
Hey there!
Ever feel like you're missing something big in the market?
Do you sometimes miss a rally because you don’t know if a pump is a fake out or if the trend has actually changed from bearish to bullish?
This is similar to what happened at the beginning of this year when BTC went from $20k to nearly $30k, and most people were sidelined.
If that’s the case for you, and I know I used to be in the same position as you, then you need to add this indicator to your investing toolbelt.
The Ichimoku Cloud is similar to a barometer and is like having a weather forecast for market trends
and it’s more accurate than actual weather forecasts.

Here’s what we will be covering in today’s newsletter:
Why it’s important to know what the trend is and to catch the change in direction
Know which direction the Market winds are Blowing (in less than 10 seconds)
The most important Ichimoku setting to change since crypto is 24/7 (most traders forget to do this)
The 5 Rules that signal the start of a bullish trend
The 5 warnings that signal the start of a bearish trend
Enjoy!
Kierin | Onchain Edge
Improve your cryptocurrency investment skills in just 10 minutes per week!
Why Catching The Shift from Bearish to Bullish Is A Crucial Skill To learn
In trading, it's all about the trend. Ride the bull when the market's up and hedge or short when things look bearish.
That’s the gist. However, I’m mainly a long-term swing trader slash investor.
(on occasion I do sometimes gamble with small amounts and 20x leverage but that’s only because I don’t like money. I don’t recommend that.)
It’s better to be late to the trend than to miss it altogether.
Don’t make the same mistake as "il Capo of Crypto" who predicted a $12k BTC and became a meme. Learn from your mistakes and be prepared to recognize when the market turns bullish.
See Past, Present, and Future Market Trends at a Glance
The Ichimoku Cloud (Ichimoku Kinko Hyo) is an incredibly useful indicator developed by a Japanese newspaper writer.
It provides insights into the past, present, and future market conditions, making it an essential tool for traders seeking an edge in the cryptocurrency markets.

In Japanese, "ichimoku" translates to "one look".
One look will give you the current trend of any market.
Price Below the Cloud = Bearish Trend
When the price is consistently below the cloud, it indicates a strong bearish trend. Only look to exit your positions at resistance levels.
Price Above the Cloud = Bullish Trend
When the price is above the cloud, it's a sign of a bullish trend. Only look to add to your positions at support. Use other indicators and strategies for taking profit.
Now you know what it is let’s start using it.
The most important Ichimoku setting to change since crypto is 24/7 (most traders forget to do this)
If you don't have a Tradingview account, you can sign up for a free one here.
When you are signed in to TradingView, you need to click on the indicators tab.
search for the Ichimoku cloud
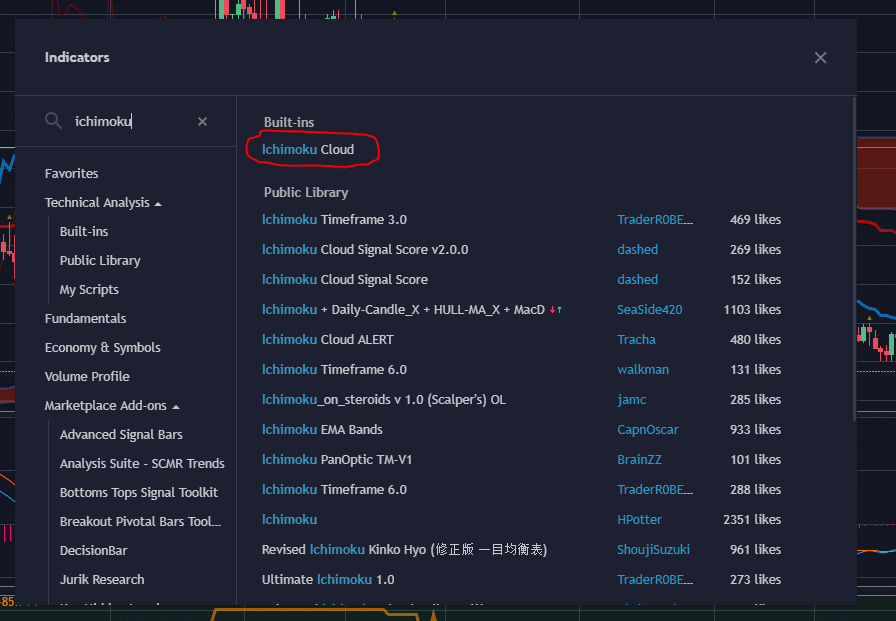
When you've installed the Ichimoku Cloud indicator on your charts, you will need to change some important settings.
Since the cryptocurrency markets are 24/7, 365 days a year, you will have to double the standard input settings.
Here are my current settings:
You can also copy my color settings if you want to have a cloud that looks similar to what you might sometimes see in my market analysis newsletter and Twitter account.
Here are my style settings. I do prefer the lagging span disabled, but for some buy strategies, you will see it's useful to have it toggled on.
The 5 Essential Ichimoku Cloud Elements to Embed in Your Trading Toolkit
The chart below contains all the elements of the Ichimoku cloud. You can bookmark this for future reference.
I rarely use the official names for the different elements of the cloud in my analysis. I say blue cloud or red line to keep things simple.
"The Ichimoku cloud can be compared to a 30-second trading trend weather forecast."
Use multiple timeframes for a more complete analysis.
For instance, what looks bullish in a short timeframe may be bearish in a longer timeframe.
Every Element is a Support in Bullish Trend
When the price is above the cloud, elements like the cloud edges (Senkou Span A and B), the red line (Kijun Sen), and the blue line (Tenkan Sen) act as support levels.
Bounces off these lines can be used as buying opportunities.
Timeframes
I like to use the Ichimoku cloud on high timeframes monthly > weekly > 3day > 1 day
The higher the timeframe the stronger the confirmation.
The 5 Rules that signal the start of a bullish trend
The signal below was triggered on the 28th of October 2023 when Bitcoin was at $28k on the daily timeframe.
BTC went to $43k after the signal. (+54%)
Here’s a checklist of what I check when looking for entries with the Ichimoku cloud.

Price Above the Cloud: Make sure the price is above the cloud, signaling a bullish trend.
Bullish Crossover: Look for the Tenkan Sen (blue line) crossing above the Kijun Sen (red line).
Lagging Span Position: The Chikou Span should be above the price action, confirming bullish momentum.
Cloud Future Projection: The future cloud (Senkou Span A and B projected forward) should be bullish, indicating continued upward momentum.
Support Confirmation: Confirm that the price is finding support at the Kijun Sen or the cloud.
The 5 warnings that signal the start of a bearish trend
The signal below was triggered in December 2022, and BTC dropped as low as $40k all the way from $57k.
I remember the moment when the Ichimoku sell signal was triggered. It was a sunny morning on the Galapagos, and I was looking at the charts, wondering
if it was the end of the bull run.
I had no idea how long the bear market would last and the upcoming massive collapse of Luna and FTX (10 months later)
Here’s the bearish Ichimoku cloud checklist:

Price Below the Cloud: This is your first indication of a bearish trend.
Bearish Crossover: Watch for the Tenkan Sen (red line) crossing below the Kijun Sen (blue line).
Lagging Span Position: The Chikou Span should be below the price action for additional confirmation of a bearish trend.
Cloud Future Projection: The future cloud should look bearish, indicating the likelihood of a continued downtrend.
Resistance Confirmation: Check that the price is encountering resistance at either the Kijun Sen or the cloud, reinforcing the sell signal.
Here’s two messages from the Onchain Edge telegram group that I shared on the 18th of October 2023 showing that the BTC trend turned bullish on 3-day timeframe.
I also anticipated a move from $28k to $37k (BTC even went higher)

Closing Thoughts
The Ichimoku cloud is probably one of the easiest tools that I use in my technical analysis. It’s incredibly powerful when using it on longterm timeframes.
While powerful, Ichimoku works best when combined with other technical analysis tools, like RSI or MACD, for confirmation.
Here are two indicators that I’ve already written about: